
Summary:
The solar industry has soared this past decade, with solar power becoming more and more affordable, along with technological advancements making solar energy more efficient.
Main Article:

The U.S. solar industry has grown significantly in the last decade as solar power has become more affordable, efficient, and accessible. Since 2014, the cost of solar panels has dropped by almost 50 percent. The U.S. now has over 2 million solar installations, which produce enough solar electricity each year to power more than 12 million homes. According to data from Google’s Project Sunroof, the share of solar-viable buildings that have a solar installation in the U.S. is a mere 1.2 percent, but many cities boast much larger percentages.
In the first quarter of 2020, solar made up 40 percent of new electricity generating capacity added in the U.S. The increase in solar power is part of a trend toward increased utilization of renewable energy, including solar panels, wind energy, biomass, hydropower, and geothermal. As of 2018, renewable energy accounted for over 20 percent of total electricity capacity, up from less than 12 percent in 2009.
Compared to other nations, the U.S. ranks second (behind China) in renewable energy capacity. When considering just solar capacity, the U.S. ranks third behind China and Japan. In the U.S., increases in solar capacity and generation have come from both utility-scale and distributed solar installations. Utility-scale solar power facilities produce power that is fed into the electrical grid and ultimately sold to customers in different locations. On the other hand, distributed solar installations (such as commercial and residential rooftop solar installations) are smaller in size and produce electricity at the location it is consumed. Utility-scale solar power generation has increased nearly 60-fold since 2010, and small-scale distributed solar energy generation has increased by almost 15-fold over the same time span.
While solar energy has come down greatly in cost, price is still a barrier to many U.S. households who want to invest in rooftop solar installation. To help offset the solar installation cost, a federal solar tax credit allows taxpayers to deduct 26 percent of the cost of installing a solar power system. Additionally, many states offer solar rebates for home solar energy systems. California even mandates that new construction homes have a solar power system.
Not surprisingly, solar energy use and investment varies considerably across states and cities. Geographic areas that receive a lot of sunlight are more conducive to solar energy, but high air temperatures make solar panels less efficient. At the state level, Hawaii and California have the largest share of solar-viable buildings equipped with solar power systems, at 12.4 percent and 3.9 percent, respectively. North Dakota and South Dakota have the lowest shares of viable buildings with solar power, both at close to 0.03 percent.
To determine the cities investing the most in solar power, researchers at Porch analyzed the latest data on small-scale rooftop solar installations from Google’s Project Sunroof. The researchers ranked cities according to the share of viable buildings with solar power. Researchers also looked at the total number of buildings with solar panels, the share of all buildings that are solar-viable, the total buildings that are solar-viable, and the median annual solar power potential per viable roof. For context, the average annual electricity consumption for an American home is 10,972 kilowatt-hours per year.
To improve relevance, only cities with at least 100,000 people were included in the analysis. Additionally, cities were grouped into the following cohorts based on population size:
- Small cities: 100,000-149,999
- Midsize cities: 150,000-349,999
- Large cities: more than 350,000
Here are the cities investing the most in solar.
- Share of viable buildings with solar: 1.6%
- Total buildings with solar: 1,469
- Share of all buildings that are solar-viable: 84.3%
- Total buildings that are solar-viable: 91,992
- Median annual solar potential per viable roof: 10,353 kilowatt-hours
- Share of viable buildings with solar: 2.2%
- Total buildings with solar: 2,860
- Share of all buildings that are solar-viable: 89.4%
- Total buildings that are solar-viable: 131,992
- Median annual solar potential per viable roof: 15,653 kilowatt-hours
- Share of viable buildings with solar: 2.4%
- Total buildings with solar: 10,487
- Share of all buildings that are solar-viable: 96.3%
- Total buildings that are solar-viable: 429,903
- Median annual solar potential per viable roof: 22,721 kilowatt-hours
- Share of viable buildings with solar: 2.5%
- Total buildings with solar: 1,956
- Share of all buildings that are solar-viable: 88.8%
- Total buildings that are solar-viable: 77,120
- Median annual solar potential per viable roof: 11,859 kilowatt-hours
- Share of viable buildings with solar: 2.5%
- Total buildings with solar: 3,093
- Share of all buildings that are solar-viable: 96.5%
- Total buildings that are solar-viable: 124,293
- Median annual solar potential per viable roof: 18,552 kilowatt-hours
- Share of viable buildings with solar: 2.7%
- Total buildings with solar: 17,231
- Share of all buildings that are solar-viable: 82.0%
- Total buildings that are solar-viable: 647,621
- Median annual solar potential per viable roof: 12,356 kilowatt-hours
- Share of viable buildings with solar: 2.8%
- Total buildings with solar: 3,582
- Share of all buildings that are solar-viable: 72.1%
- Total buildings that are solar-viable: 129,386
- Median annual solar potential per viable roof: 9,023 kilowatt-hours
- Share of viable buildings with solar: 2.8%
- Total buildings with solar: 4,437
- Share of all buildings that are solar-viable: 94.7%
- Total buildings that are solar-viable: 155,813
- Median annual solar potential per viable roof: 22,212 kilowatt-hours
- Share of viable buildings with solar: 2.9%
- Total buildings with solar: 2,617
- Share of all buildings that are solar-viable: 90.2%
- Total buildings that are solar-viable: 89,195
- Median annual solar potential per viable roof: 12,450 kilowatt-hours
- Share of viable buildings with solar: 3.3%
- Total buildings with solar: 2,133
- Share of all buildings that are solar-viable: 96.5%
- Total buildings that are solar-viable: 64,663
- Median annual solar potential per viable roof: 23,004 kilowatt-hours
- Share of viable buildings with solar: 3.4%
- Total buildings with solar: 4,322
- Share of all buildings that are solar-viable: 94.3%
- Total buildings that are solar-viable: 126,208
- Median annual solar potential per viable roof: 17,876 kilowatt-hours
- Share of viable buildings with solar: 4.5%
- Total buildings with solar: 4,607
- Share of all buildings that are solar-viable: 97.4%
- Total buildings that are solar-viable: 101,638
- Median annual solar potential per viable roof: 24,811 kilowatt-hours
- Share of viable buildings with solar: 5.1%
- Total buildings with solar: 6,945
- Share of all buildings that are solar-viable: 95.6%
- Total buildings that are solar-viable: 135,515
- Median annual solar potential per viable roof: 21,795 kilowatt-hours
- Share of viable buildings with solar: 5.8%
- Total buildings with solar: 17,281
- Share of all buildings that are solar-viable: 94.5%
- Total buildings that are solar-viable: 300,390
- Median annual solar potential per viable roof: 19,511 kilowatt-hours
- Share of viable buildings with solar: 6.4%
- Total buildings with solar: 13,557
- Share of all buildings that are solar-viable: 96.6%
- Total buildings that are solar-viable: 210,786
Median annual solar potential per viable roof: 21,543 kilowatt-hours
Out of the top 15 large cities with the highest share of viable buildings with solar, nine are located in sunny California. On average, the share of viable buildings with solar among these 15 cities is 3.4 percent, almost triple the national rate of 1.2 percent. Additionally, these cities have a large percentage of buildings that are solar viable and the average annual solar potential per viable roof is 17,581 kilowatt-hours, well above the national value of 12,570 kilowatt-hours.
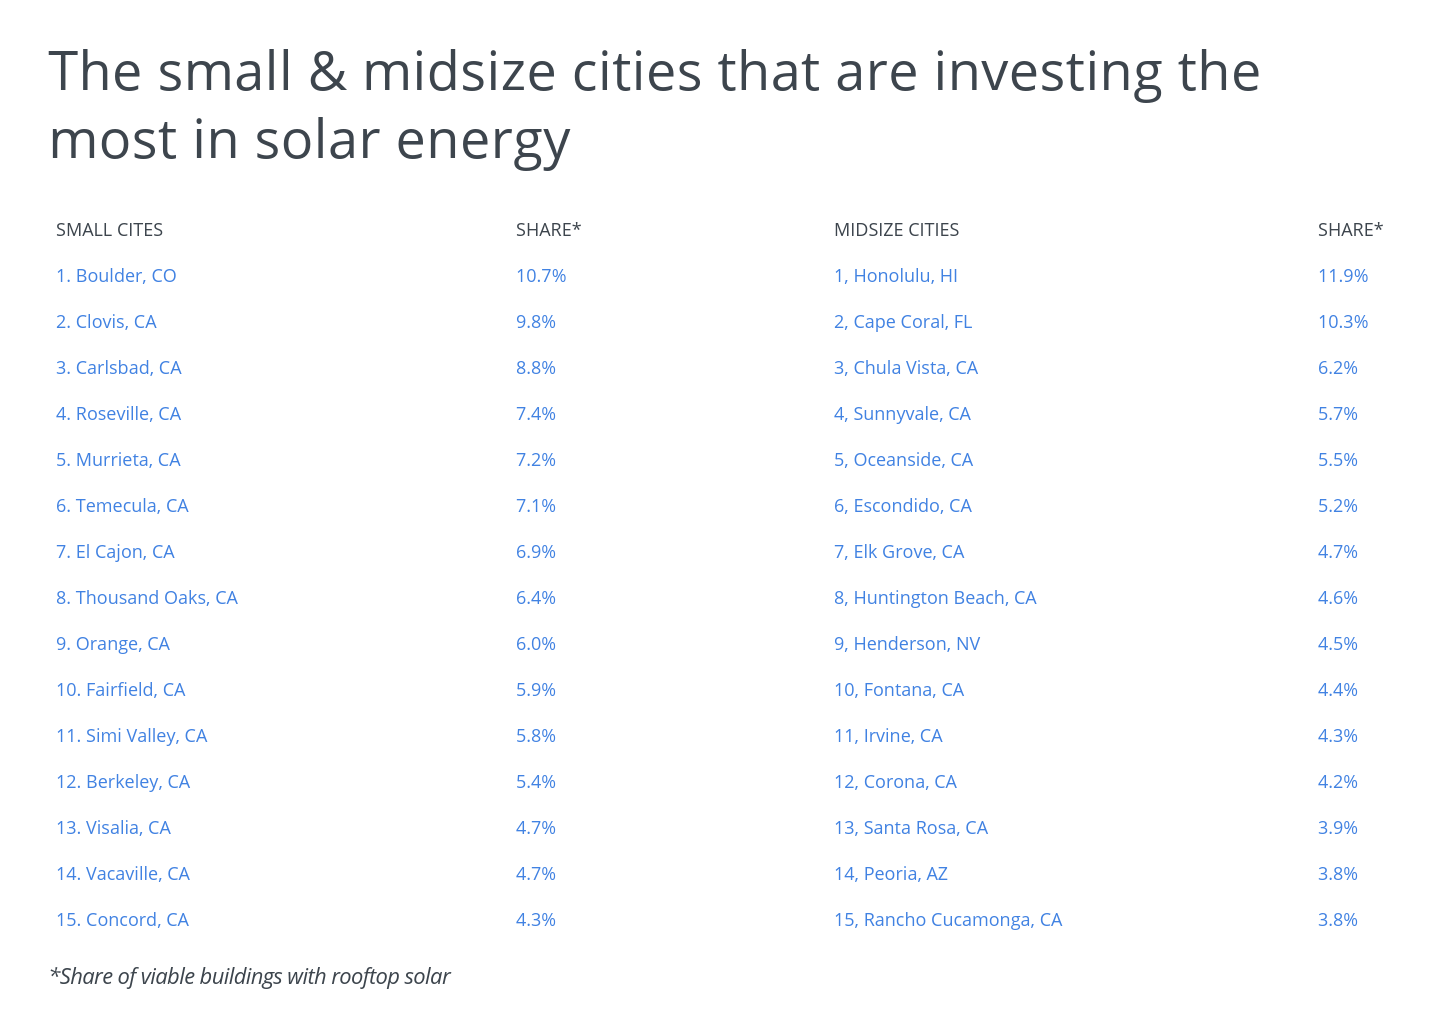
Similar to the large city group, many of the small and midsize cities with the largest share of viable buildings with solar are located in California. However, the city with the highest density of solar installations in the country is Honolulu, where nearly 12 percent of viable buildings have solar. Boulder ranks a close second, with 10.7 percent of its viable buildings having solar power.
To determine the cities investing the most in solar power, researchers at Porch analyzed the latest data from Google’s Project Sunroof. The researchers ranked cities according to the share of viable buildings with solar panels. In the event of a tie, the city with more buildings with solar power was ranked higher. Researchers also looked at the share of all buildings that are solar-viable, the total buildings that are solar-viable, and the median annual solar potential per viable roof. For a roof to be solar-viable, it must be able to accommodate at least four adjacent solar panels, with a total potential solar installation size of at least 2kW. Additionally, each potential panel must receive at least 75 percent as much energy as an ideally oriented and unshaded panel in that county.
To improve relevance, only cities with at least 100,000 people were included in the analysis. Additionally, cities were grouped into the following cohorts based on population size:
- Small cities: 100,000-149,999
- Midsize cities: 150,000-349,999
- Large cities: more than 350,000
Customize your home and create your own solar array using the HahaSmart design DIY tool and then check the cost using the price checker tool.


Input your address to see if it is solar friendly and how much you can save with solar.
Great. Your address is perfect for solar. Solar incentive is still available. Select monthly utility cost and calculate the size of solar system you will need now.
| kw System size | years Payback period | Lifetime savings |
No money down, 100% finance is available.

|
You design, we deliver. Enjoy solar! Get Started |
CompanyAbout Solar QC Contact us Career Promotion Program |
About SolarSolar Beginner 101 Solar QC Blog News Feed FAQ |
How It WorksEasy Step 1234 2 Min Design DIY Price Checker Design DIY |
Installer Sign UpSign up to receive more high quality fresh leads. Sign up now |
|
Go Solar with Solar QC. There’s no need to shop around since Solar QC directs manufacturers to our customers with the best prices in solar industry.
|
Solar InstallerInstaller Review Join Us Finance |
ProductPanel Inverter Racking BOS |
World Class BrandCanadian Solar Solar Edge Dual Rack |
Installer APP DownloadIOS Ipad Android |
Term & Condition• Privacy Policy• Site Map• COPYRIGHT © SOLAR QC 2016 - 2024 TEL:(818) 254-8209
Welcome to the Solar QC Website. This site equips homeowners with information regarding the most effective solar products and provides access to expert solar installers and manufacturers. The information listed in the Terms & Conditions provides a list of the services provided by solarqcgroup.com with specific user obligations in reference to content, conduct, company disclaimers, copyright, and privacy. The Terms & Conditions described are designed to protect the users and solarqcgroup.com. By accessing this website, the user automatically agrees with the content of the Terms & Conditions.
A solar PV system is custom-designed for your home. Final solar system price may vary based on your location, monthly utility bill, government incentives and rebates, the condition of your home, and local installation prices. Solar PV system output and estimated savings are calculated based on several factors including product type, system production, geography, weather, shade, electricity use, full utilization of the 30% solar investment tax credit, and utility rate structures and rate increases. Savings on your total electricity costs are not guaranteed. Financing options and terms vary by location, and may not be available in all areas. Solar QC is neither the lender nor the project installer. Solar QC License# 1130591

Comments (7)
e
e
e
e
Investment is one of the best ways to achieve financial freedom.For a beginner there are so many challenges you face.Trading on the Crypto market has been a life changer for me.I almost gave up on cryptocurrency at some point, until I got a proficient trader Bernie Doran,he gave me all the information required to succeed in trading I invested $2000. and got back $25,500. within 3 days of investment.His strategies and signals are the best reach out to him on Gmail : BERNIEDORANSIGNALS@GMAIL.COM
Always prayed to be able to afford my needs, I had everything going well till I lost my job and things went south, the pandemic made things worse, the situation dealt with my report and my FICO score became too low, I could get a home, I had late payments, liens and inquiries on my report. I took a cue from a friend whom had similar issues but was helped by Lanx Credit Solution and contacted them, it didn’t even take 2 weeks and I got everything back, they removed all derogatory items and increased my FICO score to 780 now with a very good credit things are beginning to look up for me and my family. You can get them on [LANXCREDITSOLUTION@GMAIL.COM (214) 888 9709]. Tell them Avery referred you.
I had a poor credit which was largely due to identity theft, I needed a loan to finance my business but could not get one because my credit was not just good enough, after trying everything things went from bad to worse, the more I disputed the lower my credit score went. This continued till a Pal introduced me to Lanx Credit Solution. I explained my position and they assured me that they could help me put things in order by fixing my credit and increasing my score. They kept their words, I am still in awe. I now have a credit score of 782, all the negative items that bedeviled my credit were removed finally. It was good one. Get to them on Lanxcreditsolution@gmail.com, text/call (214) 888 9709.