Summary:
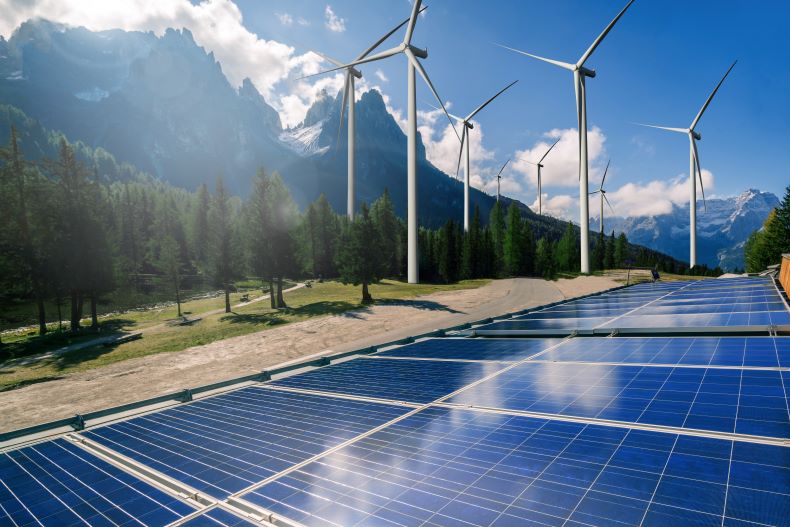
Sources of renewable energy are on track to place first in the race for new U.S. electrical generating capacity added in 2019. New sources of renewable energy capacity — mostly wind and solar panels — also exceeded that of gas in July, August and September.
Main Article:

According to a review by the SUN DAY Campaign of data recently released by both the Federal Energy Regulatory Commission (FERC) and the U.S. Energy Information Administration (EIA) for the first 10 months of 2019, the mix of sources of renewable energy is on track to place first in the race for new U.S. electrical generating capacity added in 2019.
FERC’s latest monthly “Energy Infrastructure Update” report (with data through October 31, 2019) reveals that natural gas holds a diminishing lead for 2019 with 49.67% of all new generating capacity compared to 48.45% for the mix of sources of renewable energy (wind – 28.55%, solar power – 18.59%, hydropower – 0.83%, biomass – 0.41%, geothermal – 0.06%). The balance of new capacity added includes nuclear power (0.99%), oil (0.49%), coal (0.39%) and “other” (0.01%).
Notwithstanding a strong start earlier this year, gas’ rapidly shrinking lead seems likely to disappear completely once the full 12-months of data are tabulated. In October, gas added just 1 MW of new capacity while the mix of sources of renewable energy added 721 MW. New sources of renewable energy capacity — mostly wind and solar panels — also exceeded that of gas in July, August and September.
Moreover, EIA recently reported that it “expects that an additional 7.2 GW of [new wind] capacity will come online in December 2019” alone — a one-month expansion roughly equal to the total of new gas capacity (7.8 GW) brought online in the 10 months since the beginning of the year. EIA also foresees another 14.3 GW of wind capacity coming online in 2020.
The forecast growth in new wind capacity during the remainder of 2019 is reinforced by EIA’s latest “Electric Power Monthly” report (with data through October 31, 2019) which shows that wind-generated electricity in the month of October 2019 was 32.80% higher than a year earlier while year-to-date (YTD), wind produced 9.21% more electricity than during the same 10-month period in 2018.
Likewise, solar electricity in October 2019 was 21.65% higher than in October 2018 while YTD, solar energy’s electrical output was 14.59% higher than for the same time-frame a year earlier. Small-scale solar panel installations alone grew by 19.22% YTD. Compared to all other sources of renewable energy, solar electricity has enjoyed the fastest growth rate thus far in 2019 — that for natural gas, for example, was just 6.71%. Nuclear power grew by a mere 0.08% while coal-generated electricity plunged by 14.46%.
For the first 10 months of 2019, the mix of sources of renewable energy accounted for 18.18% of the nation’s electrical generation, compared to 17.57% during the same time period a year earlier. Sources of renewable energy were also 21.95% of total available installed generating capacity — up from 20.76% a year earlier.
Solar power capacity alone is now 3.37% of the nation’s total compared to 2.93% a year ago while that of wind has expanded from 7.72% to 8.50%. In addition, wind now enjoys a clear lead over hydropower in both its share of capacity (8.50% vs. 8.43%) and actual generation (247.182 million MWh vs. 230.815 million MWh).
“If I were to predict the final numbers for the year based on the data and trends to date,” noted Ken Bossong, Executive Director of the SUN DAY Campaign, “I think it is highly probable that renewables, dominated by wind and solar, will comfortably take the lead for new capacity added in 2019 and then continue to expand their lead in 2020 and beyond.”
If you’re interested in going solar, see how much you can save by using the HahaSmart price checker tool and you can design your own solar-powered system using the design DIY tool.


Input your address to see if it is solar friendly and how much you can save with solar.
Great. Your address is perfect for solar. Solar incentive is still available. Select monthly utility cost and calculate the size of solar system you will need now.
| kw System size | years Payback period | Lifetime savings |
No money down, 100% finance is available.

|
|
Interested in Getting a Solar Panel Installation? Sign Up Here! |
Comments