
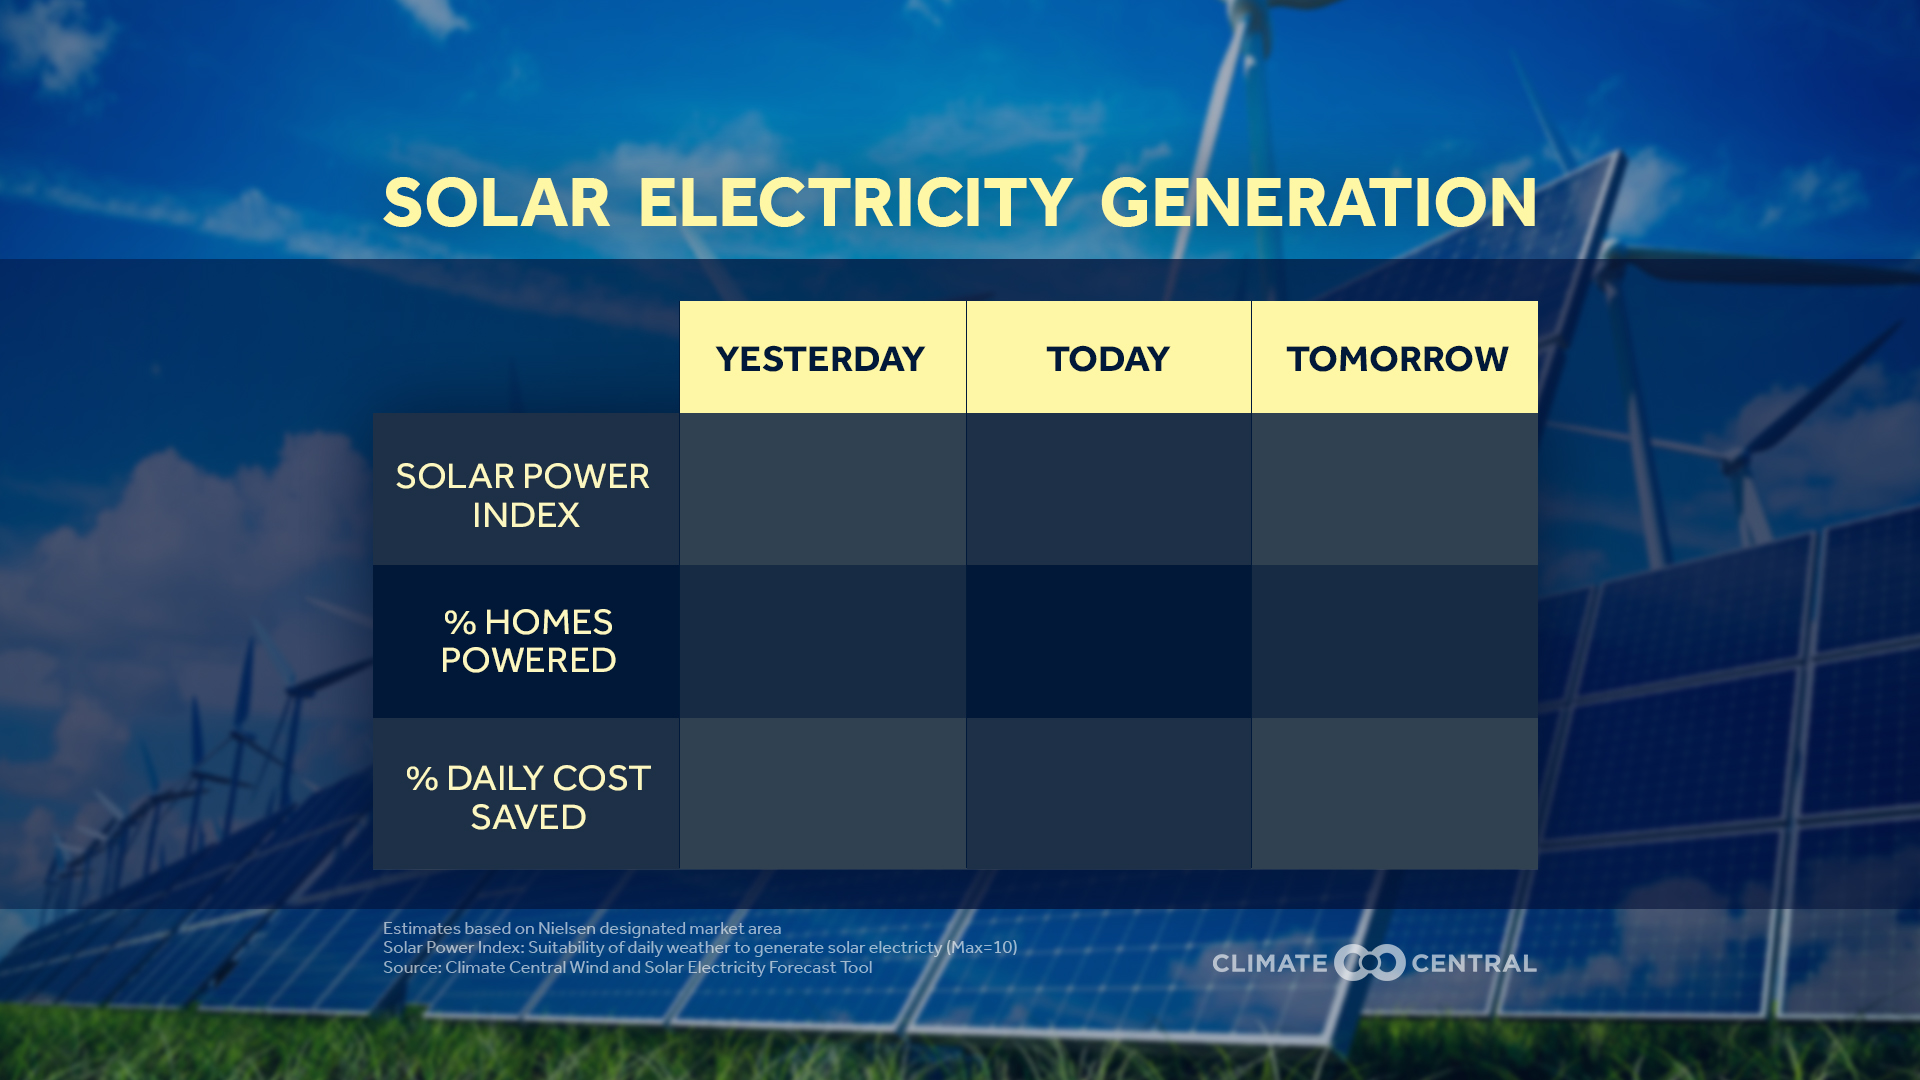
I know that yesterday Los Angeles produced 61 MW of solar power. Today, that will drop slightly to 58 MW and tomorrow it will go up to 60 MW.
I also know that 37% of the homes in Los Angeles were powered by solar energy, and the percentage of daily cost savings in electricity for households equipped with a solar power system amounted to 150%.
How do I know that?
In September 2018, Climate Central, a non-advocacy, non-profit research organization, released a free online tool that lets TV meteorologists across the United States share three-day estimates of local solar and wind power generation with their viewers, across a number of straightforward metrics.
“The tool estimates how much wind and solar electricity will be generated locally and regionally under real-time weather forecast conditions. Developed in partnership with MESO Atmospheric Research Forecasting and Simulations, the tool first uses hourly observed data to estimate how much electricity was generated yesterday. Going a step further, it uses gridded numerical weather model output and estimates of installed wind turbine and solar photovoltaic capacity to forecast the electricity that will be generated today and tomorrow. Additionally, the data are scaled to determine the percentage of homes in a media market that could be powered by wind and/or solar electricity on that day,” explains Climate Central.
But it’s not just a useful tool for meteorologists. The vast majority of Americans support expanding renewable sources of energy like solar and wind. But the average person has no easy way to understand how much power those energy sources actually generate in his or her community, on a day-to-day basis.
The methodology
According to Climate Central, each morning it downloads hourly historical and forecast data on local wind speeds and solar irradiance across the country, provided by MESO. The tool takes this data and combines it with data on installed solar and wind electricity generating capacity (sourced from the Energy Information Administration, the Open PV Project, the Solar Energy Industry Association, and the U.S. Wind Turbine Database) to calculate the amount of wind and solar electricity generated in individual locations throughout the United States. Using yesterday’s wind and sun actuals, along with projected weather data, the tool estimates yesterday’s electricity generation, and approximates the likely generation levels for today and tomorrow.
The tool estimates the amount of electricity generated (One megawatt-hour is the electricity used to light 10,000 100-watt light bulbs for 1 hour) .
It also accrues the number of homes powered divided by the total number of homes in the geographic area. And the percent of daily costs saved signifies the electricity saved by a household with an average-sized solar array on its roof versus using power only from the grid.
In addition, it provides a solar power index (0 to 10). The maximum value corresponds to a clear sky.
All users have to do to access the information is choose their region from a drop-down menu covering every state in the U.S.
“Our goal is to provide an easy-to-understand snapshot of how much the weather is already contributing to meeting local electricity needs,” said Dr. Eric Larson, a senior scientist with Climate Central and a senior research faculty member at Princeton University’s Andlinger Center for Energy and the Environment. Dr. Larson helped build the new tool.
The tool is useful to those who have already installed a solar power system on their homes because it gives you a snapshot of how much energy production you can expect from that installation.
For those not yet on the solar energy revolution, it gives them a sense of what can be achieved through a solar panel installation. The amount of money they could be saving by tapping into the sun’s energy.
To find out how much a solar power system for your home will cost, you can access the Hahasmart price checker that provides you with an estimate of equipment and installation costs by simply noting your home address and monthly electricity bill. They’ll even help you contact a reputable solar installer in your area.
The online tool is also an open window on how the region where you live is doing in the environmental scale. There’s no doubt that solar energy is the future trend of energy, allowing households to by powered solely by sunshine, cutting down their electricity bill and helping reduce the dependence on fossil fuels blamed for catastrophic climate changes.
Fossil fuels are also more expensive to use. They must be located, excavated, transported and burned to produce electricity. This entire process is invasive and detrimental to the land. Fossil fuels are also scattered and finite. Once a deposit is depleted, you must move on and look for the next one. Energy from the sun, on the other hand, is free and will be around for another 5 billion years. It can be harnessed and turned into power anywhere you can put a solar panel facing the sun.
HahaSmart Blog - More Solar Tips and Guide
HahaSmart News - Stay Informed
Your Solar Incentives - See Credits and Incentives in Your Area
Check Your Home's Solar Price - See How Much You Save
Register Now - Unlock The Lowest Solar Prices in Your Area


Input your address to see if it is solar friendly and how much you can save with solar.
Great. Your address is perfect for solar. Solar incentive is still available. Select monthly utility cost and calculate the size of solar system you will need now.
| kw System size | years Payback period | Lifetime savings |
No money down, 100% finance is available.
|
You design, we deliver. Enjoy solar! Get Started |
CompanyAbout Solar QC Contact us Career Promotion Program |
About SolarSolar Beginner 101 Solar QC Blog News Feed FAQ |
How It WorksEasy Step 1234 2 Min Design DIY Price Checker Design DIY |
Installer Sign UpSign up to receive more high quality fresh leads. Sign up now |
|
Go Solar with Solar QC. There’s no need to shop around since Solar QC directs manufacturers to our customers with the best prices in solar industry.
|
Solar InstallerInstaller Review Join Us Finance |
ProductPanel Inverter Racking BOS |
World Class BrandCanadian Solar Solar Edge Dual Rack |
Installer APP DownloadIOS Ipad Android |
Term & Condition• Privacy Policy• Site Map• COPYRIGHT © SOLAR QC 2016 - 2024 TEL:(818) 254-8209
Welcome to the Solar QC Website. This site equips homeowners with information regarding the most effective solar products and provides access to expert solar installers and manufacturers. The information listed in the Terms & Conditions provides a list of the services provided by solarqcgroup.com with specific user obligations in reference to content, conduct, company disclaimers, copyright, and privacy. The Terms & Conditions described are designed to protect the users and solarqcgroup.com. By accessing this website, the user automatically agrees with the content of the Terms & Conditions.
A solar PV system is custom-designed for your home. Final solar system price may vary based on your location, monthly utility bill, government incentives and rebates, the condition of your home, and local installation prices. Solar PV system output and estimated savings are calculated based on several factors including product type, system production, geography, weather, shade, electricity use, full utilization of the 30% solar investment tax credit, and utility rate structures and rate increases. Savings on your total electricity costs are not guaranteed. Financing options and terms vary by location, and may not be available in all areas. Solar QC is neither the lender nor the project installer. Solar QC License# 1130591
Comments